Loading...

Tag Archives for data-driven voter contact

Door-to-Door Campaigning: The Esri Component Part I

We’ve stressed the importance of face-to-face interaction, door-to-door canvassing, and boots-on-the-ground. Sometimes, however, it can all seem overwhelming. If you introduce yourself to people from nearly every demographic (especially if you live in an urban city), you want to make sure that you avoid presenting the same message to each demographic. You might know which door you’ll be knocking on, but make sure you’ve done some groundwork as to who will be opening it.

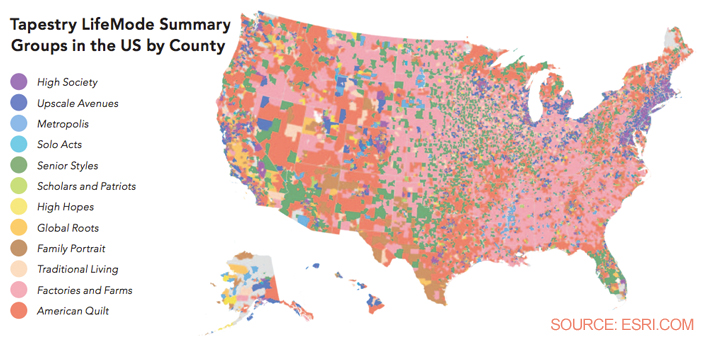
Voter Gravity has integrated Esri Tapestry Segmentation into our Esri base maps. Esri Tapestry Segmentation combines of all the possible demographics you may encounter — whether you live in an Urban city or a rural area. They break six main categories into 65 different Lifestyles. Today, we’ve broken down the large tapestry into sections that correspond to your possible campaign area and picked just a few lifestyles to share. Hopefully this can be a starting point as you tailor your face-to-face talking points and introductions in a way that will be meaningful and powerful.

A. Principal Urban Centers:

1. Laptops and Lattes: Singles/shared apartments – These solo acts own a Blackberry, bank online, shop at Banana Republic, listen to public radio, and rent cars from Budget.

2. Social Security Set: Elderly Singles – This demographic reads books, paints, and draws, consults a financial planner, attends auto-racing events, owns/leasees domestic vehicle.

3. Urban Villages: Family mix w/strong family life – These families visit sea world, have mortgage insurance, play soccer/watch soccer on TV, listen to hispanic radio, and own/lease a Toyota.

4. High Rise Renters: Families/Singles – This demographic shops at BJ’s Wholesale club, has renter’s insurance, attends ball games, listens to Urban radio, and uses public transport.

5. Metro Renters: Singles/shared – These citizens travel by plane frequently, have renter’s insurance, play tennis, listen to alternative radio, and rent cars from Hertz.

B. Metro Cities:

1. Top Rung: Families in High Society – These high floaters participate in public/civic activities, own stock worth $75,000+, vacation overseas, listen to all-news radio, and own/lease a luxury car.

2. Urban Chic: Mix households living in upscale avenues – They order from Amazon.com, trade/track investments online, buy natural organic foods, listen to classical music on radio, and spent 30,000+ on last vehicle.

3. Milk and Cookies: Middle class families living in a metropolis – These families frequent fast-food/drive-in restaurants, watch the education channels and Cartoon Network, and own/lease a Nisson.

4. Inner City Tenants: Mixed company with global roots – They play football or basketball, have a personal education loan, go dancing, read music or fashion magazines, and own/lease a Honda.

5. Dorms to Diplomas: College students, singles and shared – These youngsters participate in a variety of sports, have personal education loans, own an iPod, watch MTV, and have an auto insurance with State Farm Mutual.

C. Urban Outskirts:

1. Boomburbs: High Society Couples w/Kids in suburbs – These families shop and bank online, visit disney world (Fl), listen to sports on radio, and own/lease an SUV.

2. Main Street U.S.A.: Mixed belonging to what Esri terms “traditional living” – Buy children’s toys, games, and clothes, consult financial planner, rent movies on DVD, and watch court shows in TV.

3. College Towns: Singles/Shared multiunit rentals – Work for a political party/candidate, bank online, attend college sports events, go to bars, listen to public, alternative radio, and own/lease a toyota.

4. Southwestern Families: Family Mix – These white, Amer. Indian, and Hispanic families – have a new car loan, play soccer, football, or softball, listen to Hispanic Radio, own/lease a Nixon.

5. Metro City Edge: Families in a metropolis – These just-off-the-city-limit-dwellers are lower/middle class, bank at savings & loan, go to the movies frequently, watch courtroom shows on tv, own/lease a Buick.

D. Suburban Periphery:

1. Suburban Splendor: Married-Couple Families in High Society – They enjoy gardening, hold a large life insurance policy, stay at Hilton hotels, listen to all-news radio, and read travel, sports and magazines.

2. Silver and Gold: Married couples w/ no kids – these upper class seniors go boating and fishing, own shares in bonds, attend classical music shows/operas, and watch the golf channel.

3. Midlife Junction: Mixed combination of middle-aged, middle-class americans – these people go fishing, own U.S. Savings bonds, attend tennis matches, read 2+ daily, sunday newspapers.

4. Military Proximity: Married Couples w/Kids in a college or military environment – they play basketball, go bowling, trade stocks/bonds/funds online, watch news and sci-fi shows in TV.

5. Home Town: Mixed group living in small communities – these small town/steady job types play football, go fishing, have a personal education loan, attend country music performance, watch syndicated TV, and own/lease domestic vehicle.

E. Small Towns
*Esri only has three lifestyles for this category.

1. Cross Roads: Lower/Middle income family mix – these families watch movies on DVD, bak in person, play volleyball and softball, read fishing and hunting magazines, and own/lease a Ford.

2. Senior Sun Seekers: Married Couples w/no kids and singles – these relatively independent senior individuals are members of a fraternal order or veterans’ club, own annuities, go fishing, read, or play bingo, watch game and news shows on TV, and own/lease a station wagon.

3. Heartland Communities: Mixed group of lower/middle class individuals – they work on their lawn, garden. DIY projects, own shares in mutual funds, order products from Amazon, watch cable TV, and own.lease a domestic vehicle. 

F. Rural Areas

1. Green Acres: Prosperous, married couple homeowners – they do gardening/woodworking, have home equity credit line, attend country music shows, watch auto-racing on TV, and drive 20,000+ mi/yr.

2. Salt of the Earth: Married-Couple families in small communities with settled jobs – they enjoy gardening and outdoor projects, own CD 6+ months, watch CMT, own a motorcycle.

3. Rural Resort Dwellers: Married/Couples w/no kids living in a small town – they do woodworking and furniture refinishing, have overdraft protection, do target shooting, watch rodeo/bull riding on TV, and own an ATB/UTV.

4. Rooted Rural: Married Couple Families with lower/middle income – they own dogs, use full-service bank, go hunting, fishing horseback riding, watch rodeos, tractor pulls on TV, Own and ATV/UTV.

5. Rural Bypass: Family mix of lower/middle income – they attend auto racing events, own CDs for 6+ months, go hunting, read fishing/hunting magazines, and own/lease a compact pickup.

If you have any questions about how Esri Tapestry Segmentation fits in with Voter Gravity data, contact us today!


What Can Voter Gravity Data Do For You?

You’ve heard that Voter Gravity has an extensive voter database. But what exactly does that mean? Let’s break it down:
  • 175+ million voter records
  • Voter records across all 50 states
  • Vote history for last four to six cycles of all major elections
  • 90 million phone numbers
  • Addresses geocoded and updated every quarter
  • 65 distinctive consumer and demographic data points for voter profiles
  • Ability to keep a voter’s data when he or she moves, even across state lines
Our files come straight from local election officials, are merged into a master file where we check for up-to-date address changes and append them with phone numbers and consumer data points that are often predictive of voting behavior. This combination of official voter files with modern consumer data analytics makes the Voter Gravity file incredibly accurate and insightful.
The goal of having data is to take action. Here’s what you can do with the data at your disposal through Voter Gravity’s unique application:
  • Access voter records in your district 24/7
  • Link voter records with your Facebook friends (coming soon!)
  • Create walk lists in minutes
  • Create voter surveys and link them to phone banks and walk lists
  • Tag voters with unique attributes for your district
  • Create target voter profiles based on any combination of data points
  • Access voter data on any smartphone or tablet
Intrigued? Request a demo!

5 Ways to Keep Your Campaign Volunteers Motivated

In my last post, I gave you 14 suggestions for where to find volunteers. The volunteer process, however, is not only about who you can get, but also how you can successfully engage, manage, and propel dozens of volunteers at a time. Once you accumulate a team of enthusiastic volunteers, here are a few pointers on how to keep them enthusiastic and committed:

1) Make your issues clear so that your volunteers know what they’re supporting and can accurately pass along your main ideas to others. Just because people have volunteered for your campaign does not necessarily mean that they know the ins and outs of why you’re running and what you stand for. They could be there for any number of reasons – anything from a recommendation by a friend, to simply a supporter of the party ticket you’re running on. It’s your job to make sure that your volunteers are informed and their questions answered. 


2) Be kind. Most of these people will be working for little to no pay. They are (often) excited to actively support something they believe in, and will be driven by that excitement. Don’t ruin this by being rude. A little gratitude, a little show of friendliness despite your busy agenda will go a long way with volunteers. 

Take time to learn their names and recognize the work they accomplish. Note: how you treat your volunteers will inevitably get out into the community. The way in which you establish relationships now will reflect how you will govern once in office.


3) Show leadership. When I say be kind I do not mean be a pushover. People are following you and looking to you for direction so make sure you give them something to look up to. Your strength, conviction and character will stand out to your volunteers.

4) Give the volunteers a safe, clean, calm environment in which to work. Chances are campaign volunteers will be fielding calls, going door-to-door, calling people who may or may not be welcoming. It is your job to provide a place where your volunteers can come for answers to give to others, touch base, and relax after a long day of campaigning on your behalf. It’s a small way of showing gratitude to those who are working so hard to make you successful in your campaign. 

5) Make it fun. Just because there’s a deadline and an end-goal does not mean that you’re volunteers should be treated as soldiers or as robots. Use gamification techniques: turn tasks into friendly competitions. It’s often not as much about what you do as it is about what you don’t do. If you’re not prepared, if the volunteers feel like their tasks are of no added value, if you waste your volunteers’ time, then you will guarantee that the experience will fall flat. And don’t forget the pizza parties to keep up moral! A well fed volunteer is a happy volunteer.

Political Technology: Now We’re Faster & Even More User-Friendly

Every day, we release new updates to Voter Gravity. Here are a few big changes we’ve made recently:

1. Faster Maps: We’ve completely re-written how data loads onto maps to make them significantly faster. Also filters will load in real time. (Note: there is an issue with filters not holding when switching precincts. We are updating this function.)

2. Quick Login: If you have access to only one account, you no longer have to select that account before logging in. The system will log you in immediately after you enter your username and password.

3. Walklist Updates: Printed walklists now display the tags associated with each voter, so a canvasser will know more about that voter as they go up to the house. Admins can determine which tags appear on the walklists by going to Manage > System Tags and hiding any tags they don’t want volunteers to be able to see.

To keep up-to-date with the latest changes in Voter Gravity, visit our Support Portal. Here’s to using the best political technology to increase that person-to-person interaction, build meaningful relationships, and win!

7 Creative Ways to Target Voters

Through technology like Voter Gravity, you’re given a universe of data on your potential voters. Now what?

There’s the most obvious uses for voter data, including identifying voter history and targeting people most likely to vote for your candidate, the swing voters, and those who will vote for your opponent. You must always target voters with data in at least these two ways:

  1. Use voter history data to point volunteers to the highest turnout precincts in the final GOTV push.
  2. On election day, call and knock the precise audience most likely to help you win.

But, as we often say, good voter data contains more than just whether someone has voted before or what issues are important to them. It helps your political campaign make important decisions, from identifying donors to messaging to absentee voters.

We encourage you to get creative with the myriad of ways you can slice and dice the data in order to focus your efforts most effectively. We are fully convinced that every single modern campaign, regardless of size, must run on many forms of voter targeting.

Here are some of my favorite practical but creative ways to leverage the data that you have at your disposal as a state or local political campaign:

  1. Donors: Look at common attributes of your current donors and identify patterns that could help you identify likely future donors.
  2. Volunteers: Draw volunteers early on in the campaign from your targeted supporters. Don’t just contact them with requests to vote, but requests to volunteer and become your advocate.
  3. Absentee Voters: Identify past absentee voters and reach them early with specific messages. This allows you to give them helpful information like absentee voting deadlines, while also persuading them to vote for you.
  4. Ads: Know which voters pay attention to specific media. Combine that knowledge with other data, such as how they spend their free time or money, or the age of their children. Then, tailor any radio or TV ads to those specific voters. Or, bow out of advertising on a specific channel or station if your targeted voters aren’t a likely audience.
  5. Yard Signs: Place yard signs in areas throughout your district with high visibility to targeted voters. Also, tailor the messages on those signs to appeal to the surrounding neighborhoods.
  6. Voter Turnout: If running against an incumbent, determine the areas the incumbent faired poorly among voters.
  7. Mailings: Send (very) tailored mailings to different segments in your district. With Voter Gravity’s Esri Tapestry partnership, you can identify voters who have multiple points in common. For instance, send one mailing to the people who “own dogs, use full-service banks, go hunting, fishing, horseback riding, watch rodeos, tractor pulls on TV, and own an ATV/UTV” and another mailing to the people (in your same district) who have these points in common: “Paint and draw, have a second mortgage, listen to classical music on the radio, read baby magazines, and own motorcycles.”

How to Read the Data on Why Obama Won

We’re firm believers in taking a good, hard look at data before making that next step. This includes gathering data from past elections to better inform future campaigns. Conservatives have much to learn from last year’s Presidential Campaigns and a year later, they’re still gathering insight. That’s good.

But what’s not good is when they simply sit on the data and fail to let it affect their future actions. This is one of the reasons why Voter Gravity exists – to use data to spur real, actionable insights. The outcome? Victory for your campaign.

Yesterday, a Washington Post piece by John Sides and Lynn Vavreck titled “What really decided the 2012 election, in 10 graphs” highlighted specific stats on the 2012 Presidential Election. The graphs include the following findings:

  1. Republicans liked Romney. Really!
  2. Conservative Republicans liked Romney too.
  3. Republican primary voters were not much divided by ideology.
  4. Romney appealed to the mainstream of the party.
  5. The economic fundamentals favored Obama.
  6. Party loyalty is really powerful.
  7. Most groups of voters move in similar fashion from election to election.
  8. Obama’s “gifts” didn’t amount to much.
  9. It was hard for Obama or Romney to out-campaign the other.
  10. Romney did not lose because he was perceived as too conservative.
Read their article for more detail and for a look at the graphs themselves. We encourage you to make it your mission to keep up with data on past elections. The implications for future campaigns, including your own, can’t be overstated.

9 Ways to Track Your Social Media Success

At Voter Gravity we’re interested in the data, analytics, and science that goes into empowering a political campaign. But we’ve been there. Running a campaign takes time. And now you have a digital campaign to keep up with. Trying to keep track of who’s following you, which posts have the most influence, what times are best to post, etc. can be overwhelming. Thankfully, many have come before you and devised simpler methods and tools for tracking the success of your social media campaigns. 

Here are some awesome sites that we think will be useful in saving you time as you track your social media success and allow your digital campaign to play an important role in data-driven voter contact. Always allow the data to inform your digital strategies. Note: As a political candidate, always keep in mind that most tools used for managing company accounts will also work in managing your personal accounts.

General:

  • Social Eye allows you to manage, schedule, approve, publish and moderate your social media posts on Twitter, Facebook and anywhere else you may be posting on a regular basis. Social Eye allows you to perform a few neat tricks to optimize posting. For example, you can set specific times for when you want to post, allowing you to send out content when people are actually online rather than when your team is in the office.
  • Wildfire is actually an app powered by Google Analytics. This handy tool allows you to measure social ROI; everything from revenue on ads to donations can be measured by this little guy. This is an example of an analytics tool that is sold to businesses but will work well for campaigns as well.

Facebook:

  • Booshaka is technically a marketing platform, but this still falls into your aim to market yourself for a position of leadership. Booshaka provides features that help you understand your social media community engagement in order to develop social marketing strategies, and engage with your community in order to increase your awareness of your fan/followers base. 
  • Quintly is geared more specifically towards analyzing Facebook content and interactions, then uses those measurements to provide metrics from which you can adjust your campaign. These metrics specifically help in user interaction and finding the perfect time to post your specific content.
  • Facebook Insights are a feature of every Facebook page. Our basic message to you is: use them! Our favorite features include details about when your fans are online and the success of different post types based on average reach.

Twitter:

  • Twitonomy is an analytics tool with both free and premium versions. Premium features include search analytics, custom date ranges and even downloading data into Excel or PDF. Twitonomy provides you with a wide range of analytics including tweets per day, who you retweet most often, which of your tweets were retweeted the most, which were favorited the most and much more. 
  • Followerwonk is a free product that allows you to grow your twitter account through very specific features tailored to increase the effectiveness of your account. Bio search research is good for exploring the twitter user graph of twitter. This is especially good for outreach. You can also compare users. When you plug in the names of other users on Twitter, you are provided with a Venn Diagram comparing followers, tweets, and anything else that you may want to know about other users out there. 
  • TweetDeck brings clarity to the mess of tweets that your twitter feed would be without organization. It’s considered a staple by many Twitter users. TweetDeck can help you distinguish between tweets from specific users, direct messages, replies, and the rest of the Twitter world. This will be helpful in untangling the constant feed of information.

Bonus: And, just for fun, compare yourself to a friend (or opponent) on Visual.ly. Political analytics doesn’t have to be boring after all.

An Inside Look: Voter Gravity in 4 Minutes

New: Log in to mobile app with your email address

For those of you already taking advantage of Voter Gravity, your email address is now your username across all Voter Gravity apps and services. We’ve updated the mobile login to use the same username as the portal, so the next time you log in to voter.mobi, please remember to use your email address instead of the old username. We hope this makes remembering your login info easy!

An inside look

This week, take a step inside Voter Gravity with me. In this short clip the team titled, Creating Walk Lists, but I like to call it An Inside Look at How to Make Your Campaign More Awesome, I introduce you to the Voter Gravity portal and explain how exactly you can easily create and route user-friendly, mapped-out, optimized walk lists in five minutes. Actually, make that four minutes:

What does the Voter Gravity app actually look like? How easy is it to use? If you have questions, we want to make what we can do for you as clear as possible. View this clip and then request a demo to give you an in-depth look at how we can help your campaign complete in minutes what used to take days.

Targeting Voters with Data is a Science, but Not Rocket Science

Data is important. But unless data is used correctly, by itself it doesn’t win elections. Turning data into real, actionable insights and taking consistent, meaningful action wins elections. 

As a political candidate, targeting voters is a necessary tactic that allows you to get the most out of your voter outreach efforts. But the work doesn’t stop there.

Fine-tuning your voter contact lists is only useful if you know how to connect with that targeted audience. You won’t want to miss the chance to connect, but unless you’re intentional, you may end up doing just that. Whether you’re creating a walk list or a mailing list, making live calls or organizing local volunteers to go door-to-door, using data to determine voter history, who those voters are, and what they like, gives you insight on which voters to reach and how best to establish a connection. 

As we all know, each campaign has limited hours in a day and limited manpower. When mobilizing volunteers, understanding the best walk-lists to generate can move the vote by several percentage points. Generally, there are three broad categories into which voters fall: those who will always support your side, those who will never support your side, and those undecided. I like to call them saints, sinners, and savables. Through my experience working with grassroots activists and campaigns across the country, I’ve seen that a campaign must focus on turning savables into saints and then mobilizing the saints.

Using data to determine the right doors to knock on and people to talk to saves you valuable time. Not to mention, it makes for happy volunteers. (Knocking on the door of a staunch supporter of your opponent is never fun.) But voter history is certainly not the only factor to which you should be paying attention. Targeting a specific slice of voters allows you to bring a specific message to them. For instance:

  • Unaffiliated suburban women who are frequent voters.
  • Republican or unaffiliated voters who recently registered to vote
  • Republican, frequent voters who have not been contacted in the last three months

The 2012 Obama Campaign successfully utilized data to fine-tune voter characteristics. As Sasha Issenberg, author of The Victory Labwrites, “Obama’s analysts built statistical models to pull out other factors that distinguished voters from nonvoters. Socioeconomic factors like income and housing type played a role; those who lived in multi-tenant dwellings, for instance, were less likely to vote. But within those households Obama’s analysts found a twist. A voter living with other people who had a demonstrated history of voting was predicted as more likely to turn out herself.”

So, set your vote goal and aim to identify, persuade, and get-out-the-vote. Let analytics guide your voter-contact efforts to victory. It’s a science, but not rocket science.

Smart Partnership Leads to Smarter Campaigning

Earlier this week we announced that Voter Gravity has integrated Esri Tapestry Segmentation into our Esri base maps. I’d like to explain with some more detail as to why partnering with Esri is such an incredible step for Voter Gravity and the campaigns that use our voter contact technology.

I’m a firm believer that all politics is local. Data analysis leads to a hyperlocal campaign. If you’re reading this, I probably don’t need to convince you that that’s good. A hyperlocal campaign, no matter the size, gives a campaign the ability to contact targeted voters the right way with the right message. Which is why I’m excited to add another layer of segmenting to Voter Gravity’s technology. Esri Tapestry Segmentation ultimately “divides US residential areas into 65 distinctive segments based on socioeconomic and demographic characteristics to provide an accurate, detailed description of US neighborhoods.”

What does this mean to you?

Any map that you pull up in Voter Gravity can give you information about your targeted area based on the 65 segments, broken down into 12 Tapestry summary groups. Esri calls these “LifeMode Summary Groups” which are characterized by lifestyle, lifestage, and shared experience, such as being born in the same time period or a trait like affluence. These segments are represented by distinct colors. See the chart below for a breakdown of each summary group. So, for example, if a targeted neighborhood is shaded with the color purple, then it falls under the description of Metropolis:

LifeMode Group: L3 Metropolis

Residents in the six segments of the Metropolis group live and work in America’s cities. They live in older, single family homes or row houses built in the 1940s or earlier. Those living in larger cities tend to own fewer vehicles and rely more on public transportation; however, workers in most of the Metropolis segments commute to service related jobs. The Metropolis group reflects the segments’ diversity in housing, age, and income.

For example, ages among the segments range from Generation Xers to retirees; households include married couples with children and single parents with children. Employment status also varies from well-educated professionals to unemployed. The median household income of the group is $39,031. Their lifestyle is also uniquely urban and media oriented. They like music, especially urban and contemporary formats, which they listen to during their commutes. They watch a variety of TV programs, from news to syndicated sitcoms, and would rather see movies than read books.

Esri Tapestry Segmentation Voter Gravity

When going door-to-door, placing yard signs in the area, handing out campaign material, or sending mailers to the voters in this neighborhood, imagine how valuable it is to know this unique information about the voters you’re trying to connect with.

For a review of each Esri Tapestry segment and more info on how Esri can enhance your voter outreach efforts, take a look at Esri’s Tapestry Segmentation Reference Guide. If you’re ready to take us for a spin, contact Voter Gravity today!