Earlier this week we announced that Voter Gravity has integrated Esri Tapestry Segmentation into our Esri base maps. I’d like to explain with some more detail as to why partnering with Esri is such an incredible step for Voter Gravity and the campaigns that use our voter contact technology.
I’m a firm believer that all politics is local. Data analysis leads to a hyperlocal campaign. If you’re reading this, I probably don’t need to convince you that that’s good. A hyperlocal campaign, no matter the size, gives a campaign the ability to contact targeted voters the right way with the right message. Which is why I’m excited to add another layer of segmenting to Voter Gravity’s technology. Esri Tapestry Segmentation ultimately “divides US residential areas into 65 distinctive segments based on socioeconomic and demographic characteristics to provide an accurate, detailed description of US neighborhoods.”
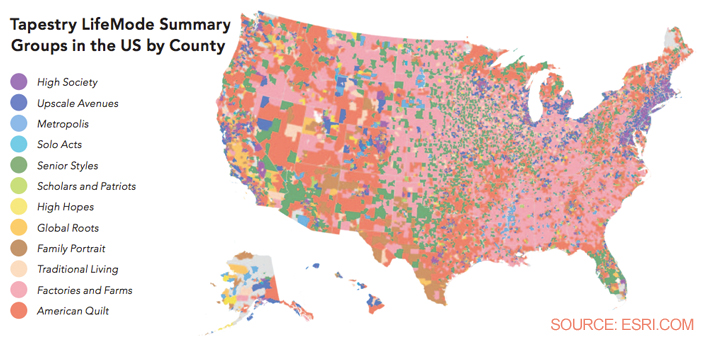
What does this mean to you?
Any map that you pull up in Voter Gravity can give you information about your targeted area based on the 65 segments, broken down into 12 Tapestry summary groups. Esri calls these “LifeMode Summary Groups” which are characterized by lifestyle, lifestage, and shared experience, such as being born in the same time period or a trait like affluence. These segments are represented by distinct colors. See the chart below for a breakdown of each summary group. So, for example, if a targeted neighborhood is shaded with the color purple, then it falls under the description of Metropolis:
Residents in the six segments of the Metropolis group live and work in America’s cities. They live in older, single family homes or row houses built in the 1940s or earlier. Those living in larger cities tend to own fewer vehicles and rely more on public transportation; however, workers in most of the Metropolis segments commute to service related jobs. The Metropolis group reflects the segments’ diversity in housing, age, and income.
For example, ages among the segments range from Generation Xers to retirees; households include married couples with children and single parents with children. Employment status also varies from well-educated professionals to unemployed. The median household income of the group is $39,031. Their lifestyle is also uniquely urban and media oriented. They like music, especially urban and contemporary formats, which they listen to during their commutes. They watch a variety of TV programs, from news to syndicated sitcoms, and would rather see movies than read books.
When going door-to-door, placing yard signs in the area, handing out campaign material, or sending mailers to the voters in this neighborhood, imagine how valuable it is to know this unique information about the voters you’re trying to connect with.
For a review of each Esri Tapestry segment and more info on how Esri can enhance your voter outreach efforts, take a look at Esri’s Tapestry Segmentation Reference Guide. If you’re ready to take us for a spin, contact Voter Gravity today!