Loading...

Spending Time on Data Organization? Zap It! Zapier + Voter Gravity

A Voter Gravity client ran a petition using SurveyMonkey. He wanted to add all email addresses collected with the petition to his email list in MailChimp. He also wanted to make sure he had a record in Voter Gravity of each individual that signed the petition, so that he could easily organize and categorize them.

This could have been an organizational nightmare. It could have required downloading spreadsheets from SurveyMonkey and manually updating lists in both Voter Gravity and MailChimp. Significant man-hours would be required in order to accomplish this kind of data management.

Fortunately for our clients, Voter Gravity is integrated with Zapier. This integration means that all the data transfers that our clients were going to do by hand, are completed automatically and seamlessly. In the instance above, not a single minute of valuable staff time had to be spent on this data entry.

We all know that most online applications don’t speak to each other. For example, you can’t send a list of emails from SurveyMonkey directly to MailChimp. You need to hire a developer to code a protocol for you. Zapier is that protocol. Clients set up an account with Zapier through Voter Gravity and all integration problems can be solved. In the case of our clients and the petition, as soon as they receive a new signature and email address, it is sent directly to their mailing list in MailChimp through Zapier. That name and address are also simultaneously recorded into the Voter Gravity database where the information is automatically checked against voter records and precinct information. Each new contact brought into Voter Gravity via that particular source in Zapier gets automatically marked with the data tag appropriate for the source.

Like Voter Gravity, Zapier is as committed to efficiency and saving you time. That’s why we use it. But don’t take our word for it. We let Zapier speak for itself. It is integrated with hundreds of web apps including Google Drive, Gmail, Dropbox, Twitter, Facebook Pages, Evernote, Podio, Wufoo, OneDrive, and WordPress. Check out the full list: The Zapbook!

Continue reading →

Deflecting Attacks: a Proven Use for Direct Mail

It’s a fact of life: politics can get dirty. Issue, policy and personal attacks are not uncommon. What strategies work in responding to negative attacks from your opponent?

In a Voter Gravity white paper titled Mailbox Metrics: The Data-Driven Impact of Campaign Direct Mail, Dr. George Hawley, Assistant Professor of Political Science at the University of Alabama, analyzed and compiled research on the direct mail and its effects on campaigns. In his research he came across some fascinating information connecting direct mail strategy and negative campaigning:

Pfau et al. found that a well-timed and orchestrated direct mail campaign can decrease the persuasiveness of an attack campaign on a candidate.Specifically, they found that direct mail can “inoculate” a potential voter against potentially-damaging attacks. If a candidate knows that his or her opponent is going to raise specific issues and make specific attacks, it may be in the candidate’s best interest to address these issues first via direct mail, and present the information in the most favorable light possible. Inoculation techniques furthermore seem to be effective whether they are targeted at people who already agree with a position or argument, those who are neutral, or those who oppose a position or argument.

Direct mail is often used in many different ways throughout a campaign, but has not been proven to make a difference in regards to GOTV. Using direct mail to deflect an attack campaign attacks is actually one of the effective ways to use mail.

For more findings on the effectiveness of political direct mail, read Dr. Hawley’s report here:Mailbox Metrics: The Data-Driven Impact of Campaign Direct Mail.

Here’s What Happens Every 60 Seconds Online

We all know that there is a ton going on around the clock in the ethereal world that is the internet; but have you ever wondered just how much is actually happening? These stats give us a glimpse into how much we do online (whether it’s productive activity is TBD) in just 60 seconds.

1: When you send an email, you are one of 204 million others who did the same thing within 60 seconds of you clicking the send button.

Continue reading →

How the “Gravity Score” helps you win

Voter Gravity allows campaigns to narrow any walk list using a large range of options, including party affiliation and gender. We’ve created a special option to help Voter Gravity users drill down even more – we call it the Gravity Score.

The Gravity Score is something we use at Voter Gravity to gauge the propensity of an individual to vote within a range from 0-12. The closer someone is to zero, the less frequent of a voter they are. So for example, if a voter has a Gravity Score of 12, they vote in every election. The exact breakdown is:

  • A vote in the 2012 general election: 5 points
  • A vote in the 2010 general election: 3 points
  • A vote in any other election: 1 point

This model weights the score towards voters who have turned out in more recent elections. We do this because we want to pay more attention to those voters who have proved themselves to be active currently as opposed to those who may or may not be active anymore. Doing this helps you know which voters are worth targeting, since it is usually not worth it to message to those voters who no longer turn out.

For operatives who are used to searching in GOP Data Center for 2 of 4 and 3 of 4 voters, this is a similar concept, just adjusted to give more value to more frequent elections. The Gravity Score is a tool to help you better understand how your voters act and what you can do to motivate them.

How to Create a Survey in 13 Simple Steps

One of the most important parts of any door-to-door campaign is the survey that you use. This is how you gather information, and one of the ways you message to the voters. It is strange that such a critical piece of a campaign is often overlooked. I have found that surveys are often thrown together somewhat haphazardly or last minute. Sometimes this is because people don’t realize how important a survey is, but often it is simply that the creators don’t leave enough time, or have the tools, to create simple, intuitive surveys.
There is nothing we can do about the first problem, but we have worked hard to make it easy for you to create high quality surveys.

Continue reading →

Importing Data Into Voter Gravity

Have you ever had problems getting different databases to talk to each other? Many campaigns run into problems with contact information or documents on only one platform or device and not another. In a fast-moving campaign environment, this can be a train wreck.

On top of that, it makes information significantly harder to find as you have to check in multiple places for it. For the same reasons, data tends to get lost or misplaced. One consolidated, integrated information center where all data is located — that can be accessed by anyone who needs it anywhere, anytime — is critical to leverage data to win elections.

Continue reading →

Rule Number 1: Use Standardized Tagging

In the political world, more and more people are talking about the idea of data tags. These tags are little pieces of information that fill out what you know about a person. One tag might be age. One might be party affiliation. Another might be most important issue facing the United States today, etc. These little bits of information, when analyzed and utilized effectively, can lend extreme power to a campaign.

This, however, begs the question: What is required to effectively utilize a data tagging system? There are many ways to effectively utilize data tags, but they all are based on one overarching principle. That principle is standardization. You must have a standardized tag that means one thing.

If you want to use any tagging system effectively, your primary focus should be standardization.  This is because the primary purpose for data tagging is so you can easily categorize groups of individuals at a glance. Consider this example: You want to find out how many people in your constituency are primarily concerned with taxes. Naturally, since you have data tags on your voters, you search for the tag “taxes.”  However, people entering the data have used all kinds of different tags for the issue of taxes.  Some have used “lower taxes,” “small business tax breaks,” or just “tax breaks.”  You are now either missing significant portions of your constituency, or you are being inefficient by having to search four different terms.

Having said this, there is nothing wrong with the tag, “lower taxes,” for example. Think of your tagging system as a very narrow search term. Will you ever want to send this person a mailer about what you plan to do with taxes generally? Then use the tag “taxes.”  Do you want to send this person information about how you are specifically going to lighten taxes on small businesses? Use “small business tax breaks” also. There is absolutely no reason why you shouldn’t have more than one tag about an individual topic, but make sure that you cover all your bases.

Think of data tags like hashtags on Twitter. You can put multiple hashtags in one tweet about a single topic. All that means is that your tweet will turn up in a few different searches. But if you want to search for all the tweets regarding a particular conference, for example, wouldn’t it be nice if that conference had one standard hashtag? No one searches all four random hashtags that people come up with for events. Standardization is key to any tagging system.

5 Things You Can Learn About Your Campaign In Real Time

Voter Gravity can do many things to help improve your understanding of what’s happening on your campaign at any given time. Here are a few of the things that you can watch in real time as the results come in from the field:

1: Doors Knocked

You can watch the number of doors that your ground game is knocking, as they come in. This allows you to keep track of how productive your volunteers are being and if they are moving faster or slower than anticipated. It can also help you know whether you will need to make more walklists for your volunteers without requiring them to contact you.

2: Supporters

This allows you to view exactly where you are in relationship to your overall campaign goal at any given time. It also gives you your conversion rate, enabling you to set accurate goals.

3: Surveys Completed

This is important. Not only does this inform you as to the general effectiveness of your volunteers and the reach of your survey, but it also indicates how many data points had been collected allowing for targeted messaging campaigns.

4: Survey Snapshot

This is a pie graph that shows you in real time the basic results of the main question to the survey of your choice. You can know at a glance which issues are most important to voters for example, by simply looking at you dashboard. This is an easy way to keep a hand on the main data points your campaign is focusing on.

5: Track Your Top Volunteers

Finally, you can follow your top volunteers as they work. Look at all the stats available on the dashboard for each individual volunteer and see who is being more effective. Then find out why. This feature also allows you to see if a particular area in your precinct is being particularly responsive on a particular day, giving you the option to redeploy volunteers there to capitalize on that.

5 Tips for Building a Political Survey

1. Clearly define the purpose of your survey.

First rule of order is to know what it is you are trying to discover before you build your survey. If you don’t have a clear idea of what you want to know or communicate in your survey, then it is impossible for you to get the results you want. After all, you don’t get what you don’t ask for, and you can’t give what you don’t have. The more clear your purpose, the better.

2. Keep the survey short and focused.

Five minutes, they said. Won’t take long at all, they said. We all know that there are very few things more irritating than excessively long surveys that we don’t have time for. Don’t perpetuate this evil. Surveys should take LITERALLY 2-5 minutes. If you can’t get the information you want in that time, the data you’re trying to collect is too complicated, and you aren’t going to be winning any favors with the voters you are contacting.

3. Keep the questions simple.

Use a series of simple questions to arrive at the destination you want to. Complex and long winded questions can be confusing to the respondent. With so little commitment for the respondent to finish, you want to make filling out your survey as simple, and enjoyable, an experience as it can be.

4. Use closed-ended questions whenever possible.

Closed-ended questions help to simplify things for your respondents. Having closed-ended questions force the answers to be concise and direct. While they may seem to cause issues to be oversimplified for the respondent, it makes their answering process easier, and quicker, also allowing for conveniently quantifiable data afterwards.

5. Pre-test your survey.

As the famous proverb says, “If you want to know what water is, don’t ask the fish.” It is always a good idea to run your survey by several uninvolved respondents before full use. You can’t assume that the respondents will have any idea where you or this survey is coming from. It has to be understandable to someone who has never given a first thought to the issues it is dealing with. On the flip side, you are so immersed in your topic that you don’t even realize that some things are just not common knowledge. A little outside perspective can do wonders.

6 Steps to Creating Walk Lists Based on Common Sense

I was door knocking for a campaign one day and I finished all addresses in this one neighborhood. The walk list then indicated that I had several more addresses in a neighborhood to the north, just on the other side of a major highway. So I crossed the road and finished the walk list only to discover that my next list had me right back in the same neighborhood where I was before I had crossed.

Multiple lists and multiple crossings later (multiple exasperated exclamations as well), I realized what was going on. These walk lists were all oriented vertically (i.e. north, south) and were therefore grabbing addresses based on proximity. It didn’t take into account the fact that these were two completely different neighborhoods.

The walk lists were created based on some system or algorithm that made sense spatially, but made absolutely no sense from a practical, efficiency standpoint. I know that my experience was not a blue moon event. Based on my work with various different campaigns, and talking with multiple volunteers, this sort of inefficiency is not uncommon.

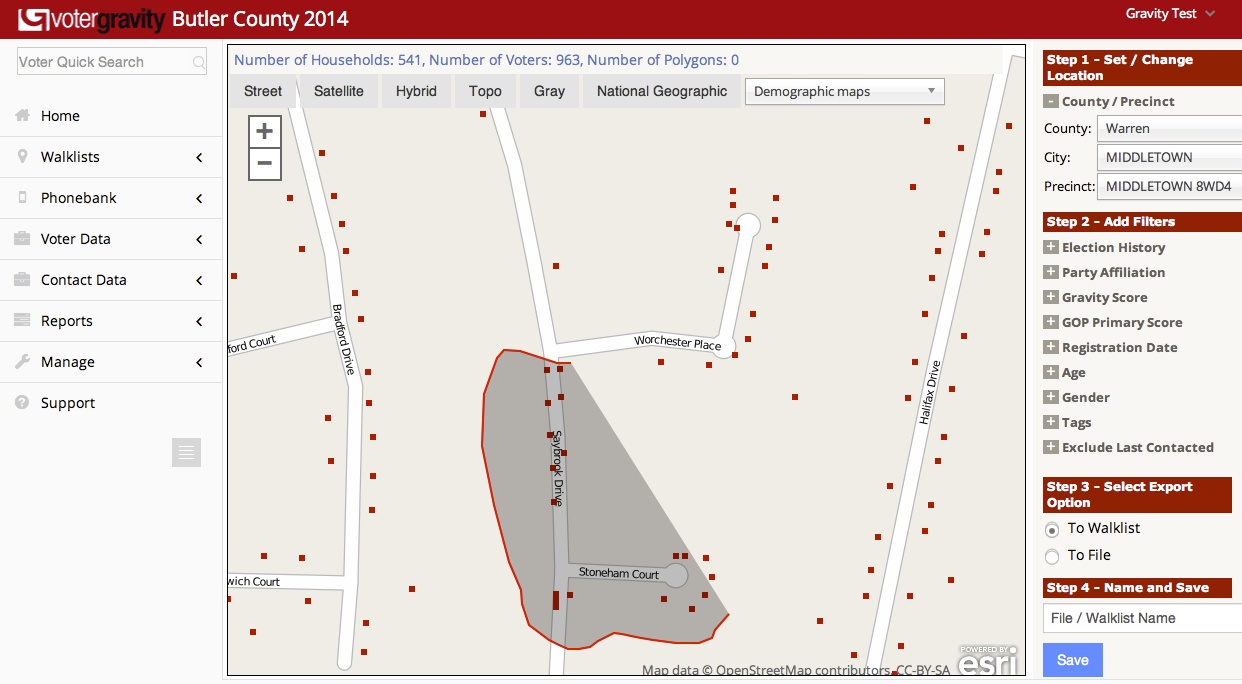
When you create a walk list with Voter Gravity, you literally look at a map and draw a circle around the houses you want in any given walk list. As an intelligent, experienced individual, you can evaluate each situation and decide on the best break up of a neighborhood. You can guarantee that the walk lists work well together, moving seamlessly between each other with the least amount of backtracking or unnecessary delays possible. Map-based walk list creation will save you, your staff, and your volunteers significant amounts of time as you work in the field, making you a more efficient and productive campaign. This is the kind of efficiency required for victory.

This kind of walk list creation is so easy it only takes a couple of minutes. (And I really mean a couple of minutes, not one of these, “Let me put you on hold for a couple of minutes” uses of the phrase.) Here are the 6 basic steps required to create the kind of walk lists that you have been wanting.

1. After logging into the Voter Gravity portal, go to Walklists > Create.

2. Next, you will see three selection boxes. Select the county, city, and precinct you wish to create walk lists for and click ‘Submit.’

3. Narrow down your walk list based on specific criteria such as election history, party affiliation, age, gender, and tags. These categories are to the side of the window, and you can use as many or as few as you would like, giving you the ability to target each list.

4. Once you have filtered your walklist, you’ll then want to select an export option. This is towards the bottom of the sidebar under the “Step 3” heading. Here you can choose to export to walk list or to file. Selecting either will enable you to then draw a polygon around the households on the map you wish to include in your walk list.

Start with the logical place on the map where a canvasser would start. This could be a convenient parking place, like a park or church, the entrance to a subdivision, or a major intersection. Then, create your first walklist there.

Next, create another walklist in immediate proximity to the first list. Move through the precinct creating walklist that are close to each other, just as a canvasser would.

By creating your walk lists in this order, the individual lists flow together more smoothly and just become natural checkpoints for a canvasser as they move through a precinct.

5. After you have selected which households you wish to target, you then need to name and save your walk lists.

6. Clicking ‘Save’ will allow you to choose whether or not to ‘Export and draw more walk lists’ or Export and optimize walk list.’ If you choose to draw more walk lists, you can continue filtering walk lists based on the first 5 steps above. If you decide to optimize your walk lists, you’ll then be taken to the Optimize screen. The Optimize screen allows you to manipulate the specific order in the list each address will appear, making certain that you have the most efficient route.

Screen Shot