Loading...

Tag Archives for campaign technology

What Can Voter Gravity Data Do For You?

You’ve heard that Voter Gravity has an extensive voter database. But what exactly does that mean? Let’s break it down:
  • 175+ million voter records
  • Voter records across all 50 states
  • Vote history for last four to six cycles of all major elections
  • 90 million phone numbers
  • Addresses geocoded and updated every quarter
  • 65 distinctive consumer and demographic data points for voter profiles
  • Ability to keep a voter’s data when he or she moves, even across state lines
Our files come straight from local election officials, are merged into a master file where we check for up-to-date address changes and append them with phone numbers and consumer data points that are often predictive of voting behavior. This combination of official voter files with modern consumer data analytics makes the Voter Gravity file incredibly accurate and insightful.
The goal of having data is to take action. Here’s what you can do with the data at your disposal through Voter Gravity’s unique application:
  • Access voter records in your district 24/7
  • Link voter records with your Facebook friends (coming soon!)
  • Create walk lists in minutes
  • Create voter surveys and link them to phone banks and walk lists
  • Tag voters with unique attributes for your district
  • Create target voter profiles based on any combination of data points
  • Access voter data on any smartphone or tablet
Intrigued? Request a demo!

Political Technology: Now We’re Faster & Even More User-Friendly

Every day, we release new updates to Voter Gravity. Here are a few big changes we’ve made recently:

1. Faster Maps: We’ve completely re-written how data loads onto maps to make them significantly faster. Also filters will load in real time. (Note: there is an issue with filters not holding when switching precincts. We are updating this function.)

2. Quick Login: If you have access to only one account, you no longer have to select that account before logging in. The system will log you in immediately after you enter your username and password.

3. Walklist Updates: Printed walklists now display the tags associated with each voter, so a canvasser will know more about that voter as they go up to the house. Admins can determine which tags appear on the walklists by going to Manage > System Tags and hiding any tags they don’t want volunteers to be able to see.

To keep up-to-date with the latest changes in Voter Gravity, visit our Support Portal. Here’s to using the best political technology to increase that person-to-person interaction, build meaningful relationships, and win!

How to Build Your Own Survey

Customize with Voter Gravity’s Survey Builder

The survey is a critical tool for campaigns to use when going door-to-door or phone banking. Campaigns of all sizes benefit from determining – and recording – the issues with which their voters identify most strongly.

The ability for candidates to create their own customized surveys for their unique campaigns is something we’re very excited about. Campaign staff can easily build surveys through Voter Gravity, allowing you to connect with voters and gather the data that will best serve your campaign! Check out my “how to” video on the step by step process of building a survey. 

Continue reading →

How to Read the Data on Why Obama Won

We’re firm believers in taking a good, hard look at data before making that next step. This includes gathering data from past elections to better inform future campaigns. Conservatives have much to learn from last year’s Presidential Campaigns and a year later, they’re still gathering insight. That’s good.

But what’s not good is when they simply sit on the data and fail to let it affect their future actions. This is one of the reasons why Voter Gravity exists – to use data to spur real, actionable insights. The outcome? Victory for your campaign.

Yesterday, a Washington Post piece by John Sides and Lynn Vavreck titled “What really decided the 2012 election, in 10 graphs” highlighted specific stats on the 2012 Presidential Election. The graphs include the following findings:

  1. Republicans liked Romney. Really!
  2. Conservative Republicans liked Romney too.
  3. Republican primary voters were not much divided by ideology.
  4. Romney appealed to the mainstream of the party.
  5. The economic fundamentals favored Obama.
  6. Party loyalty is really powerful.
  7. Most groups of voters move in similar fashion from election to election.
  8. Obama’s “gifts” didn’t amount to much.
  9. It was hard for Obama or Romney to out-campaign the other.
  10. Romney did not lose because he was perceived as too conservative.
Read their article for more detail and for a look at the graphs themselves. We encourage you to make it your mission to keep up with data on past elections. The implications for future campaigns, including your own, can’t be overstated.

An Inside Look: Voter Gravity in 4 Minutes

New: Log in to mobile app with your email address

For those of you already taking advantage of Voter Gravity, your email address is now your username across all Voter Gravity apps and services. We’ve updated the mobile login to use the same username as the portal, so the next time you log in to voter.mobi, please remember to use your email address instead of the old username. We hope this makes remembering your login info easy!

An inside look

This week, take a step inside Voter Gravity with me. In this short clip the team titled, Creating Walk Lists, but I like to call it An Inside Look at How to Make Your Campaign More Awesome, I introduce you to the Voter Gravity portal and explain how exactly you can easily create and route user-friendly, mapped-out, optimized walk lists in five minutes. Actually, make that four minutes:

What does the Voter Gravity app actually look like? How easy is it to use? If you have questions, we want to make what we can do for you as clear as possible. View this clip and then request a demo to give you an in-depth look at how we can help your campaign complete in minutes what used to take days.

Targeting Voters with Data is a Science, but Not Rocket Science

Data is important. But unless data is used correctly, by itself it doesn’t win elections. Turning data into real, actionable insights and taking consistent, meaningful action wins elections. 

As a political candidate, targeting voters is a necessary tactic that allows you to get the most out of your voter outreach efforts. But the work doesn’t stop there.

Fine-tuning your voter contact lists is only useful if you know how to connect with that targeted audience. You won’t want to miss the chance to connect, but unless you’re intentional, you may end up doing just that. Whether you’re creating a walk list or a mailing list, making live calls or organizing local volunteers to go door-to-door, using data to determine voter history, who those voters are, and what they like, gives you insight on which voters to reach and how best to establish a connection. 

As we all know, each campaign has limited hours in a day and limited manpower. When mobilizing volunteers, understanding the best walk-lists to generate can move the vote by several percentage points. Generally, there are three broad categories into which voters fall: those who will always support your side, those who will never support your side, and those undecided. I like to call them saints, sinners, and savables. Through my experience working with grassroots activists and campaigns across the country, I’ve seen that a campaign must focus on turning savables into saints and then mobilizing the saints.

Using data to determine the right doors to knock on and people to talk to saves you valuable time. Not to mention, it makes for happy volunteers. (Knocking on the door of a staunch supporter of your opponent is never fun.) But voter history is certainly not the only factor to which you should be paying attention. Targeting a specific slice of voters allows you to bring a specific message to them. For instance:

  • Unaffiliated suburban women who are frequent voters.
  • Republican or unaffiliated voters who recently registered to vote
  • Republican, frequent voters who have not been contacted in the last three months

The 2012 Obama Campaign successfully utilized data to fine-tune voter characteristics. As Sasha Issenberg, author of The Victory Labwrites, “Obama’s analysts built statistical models to pull out other factors that distinguished voters from nonvoters. Socioeconomic factors like income and housing type played a role; those who lived in multi-tenant dwellings, for instance, were less likely to vote. But within those households Obama’s analysts found a twist. A voter living with other people who had a demonstrated history of voting was predicted as more likely to turn out herself.”

So, set your vote goal and aim to identify, persuade, and get-out-the-vote. Let analytics guide your voter-contact efforts to victory. It’s a science, but not rocket science.

Smart Partnership Leads to Smarter Campaigning

Earlier this week we announced that Voter Gravity has integrated Esri Tapestry Segmentation into our Esri base maps. I’d like to explain with some more detail as to why partnering with Esri is such an incredible step for Voter Gravity and the campaigns that use our voter contact technology.

I’m a firm believer that all politics is local. Data analysis leads to a hyperlocal campaign. If you’re reading this, I probably don’t need to convince you that that’s good. A hyperlocal campaign, no matter the size, gives a campaign the ability to contact targeted voters the right way with the right message. Which is why I’m excited to add another layer of segmenting to Voter Gravity’s technology. Esri Tapestry Segmentation ultimately “divides US residential areas into 65 distinctive segments based on socioeconomic and demographic characteristics to provide an accurate, detailed description of US neighborhoods.”

What does this mean to you?

Any map that you pull up in Voter Gravity can give you information about your targeted area based on the 65 segments, broken down into 12 Tapestry summary groups. Esri calls these “LifeMode Summary Groups” which are characterized by lifestyle, lifestage, and shared experience, such as being born in the same time period or a trait like affluence. These segments are represented by distinct colors. See the chart below for a breakdown of each summary group. So, for example, if a targeted neighborhood is shaded with the color purple, then it falls under the description of Metropolis:

LifeMode Group: L3 Metropolis

Residents in the six segments of the Metropolis group live and work in America’s cities. They live in older, single family homes or row houses built in the 1940s or earlier. Those living in larger cities tend to own fewer vehicles and rely more on public transportation; however, workers in most of the Metropolis segments commute to service related jobs. The Metropolis group reflects the segments’ diversity in housing, age, and income.

For example, ages among the segments range from Generation Xers to retirees; households include married couples with children and single parents with children. Employment status also varies from well-educated professionals to unemployed. The median household income of the group is $39,031. Their lifestyle is also uniquely urban and media oriented. They like music, especially urban and contemporary formats, which they listen to during their commutes. They watch a variety of TV programs, from news to syndicated sitcoms, and would rather see movies than read books.

Esri Tapestry Segmentation Voter Gravity

When going door-to-door, placing yard signs in the area, handing out campaign material, or sending mailers to the voters in this neighborhood, imagine how valuable it is to know this unique information about the voters you’re trying to connect with.

For a review of each Esri Tapestry segment and more info on how Esri can enhance your voter outreach efforts, take a look at Esri’s Tapestry Segmentation Reference Guide. If you’re ready to take us for a spin, contact Voter Gravity today!

Digital Campaigning: Capture Your Audience in Eight Seconds Flat

Ten years ago you had 12 minute attention spans to work with in attracting voters online. Today, you have 8 seconds. Whether we like it or not, social media is the new currency, and unless we adjust accordingly, we’ll be broke. 

If you’ve already made adjustments and have an online presence, then you’re doing much better than many of your colleagues. But having a web presence alone was cutting edge in the ’90s. Welcome to 2013. 

With the competition from the Left and the advancements in digital campaigning and political technology, including data-driven analytics, testing, and optimization, it’s not enough to simply exist online. 

Gain an edge by utilizing the latest technology – offline by turning data into votes on the ground – and online using tools and digital strategies to capture the attention of your voters and empower your offline campaign. 

Here are five practical guidelines to grabbing attention and keeping it:

1. Position your important information strategically
The average page visit lasts a little less than a minute, so make sure that your viewer’s eye is drawn to the most crucial part of your campaign from the moment he or she access the site. For example, if your mission statement is what you think will empower supporters, place it in large text at the top. And as always, test it out. Is your important information placed strategically? Use online tools such as Usability Hub’s Five Second Test, which gives users the ability to test sections of their site against a random audience.

2. Avoid clutter
Everyone is tempted to put all their information on that first page, but don’t do it. Rather than overwhelm your audience with cluttered content, simplify your home page and make it interesting enough so that people will want to click through to your more meaty platform. Today, with the dominance of technology and social media in every sphere, including politics, it is well worth the time and funds to hire a professional web designer. This will ensure that your layout highlights the important information without losing anything crucial and keeps the reader on your website.

3. Ensure that your website is running properly
This may seem simple, studies show that if a website takes longer than 3 seconds to load, 40% of users will abandon the page. The faster your site loads the better your chances that people will actually read your website, let alone click through it. There are online tools that you can download to ensure your website reaches its maximum viewing potential.

4. Connect to your other social media networks
Online campaigning doesn’t stop with the website. Facebook is a must for the modern campaign. We think Twitter is too. Think of social networks as different social functions. The more events you go to, the more people you meet, and the more you get the word out, the more reach you will have for your ideas. A website is the perfect place to advertise your presence on other social networks. Use it to interact with your audience and broadened your reach.

5. Analyze and improve
Here at Voter Gravity we live and breath data and analytics. Never implement a suggestion without testing and analyzing if it actually works for you. Only by looking back and determining who has visited your site, clicked through links, commented on posts, used certain search terms, etc. can you craft your digital strategy into something truly successful. If the numbers don’t add up, then make improvements. Google Analytics recently released a report about how the Obama 2012 campaign took advantage of Google Analytic tools to gain an upper edge: “Having quick and easy access to actionable data was essential for President Obama’s data-driven re-election campaign in 2012…. Early on, they turned to Google Analytics to help the web, email, and ads teams understand what motivated new supporters to become more vocal advocates and regular donors over time. The team tested various secondary calls-to-action after a visitor’s initial signup or donation to encourage further involvement with the campaign.” Check out the full case study here.

Using Campaign Technology to do GOTV Right

As we enter an era of data driven politics, it’s important to know what really works and what doesn’t in regards to Get-out-the-Vote (GOTV). It is still astounding how much money was spent on robo calls and mail for GOTV in 2012. There were reports that the some campaigns were doing five robo calls a day to the same voter during the last five days of the election.

The good news in regards to where you should spend your time and money for GOTV? Alan Gerber and Donald Green have already done a study for you to let you know what works best. In their 2004 book, which has been updated, they broke down the most effective means for GOTV. (There have been even more recent updates at Yale’s research site on GOTV.) But let’s take a look at some of the techniques, with their cost and effectiveness:

Alan Gerber and Donald Green GOTV Study
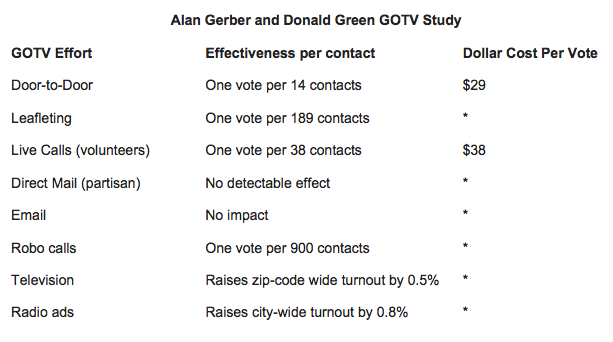
Now the study notes that the * means “Cost effectiveness is not calculated for tactics that are not proven to raise turnout” and that “door-to-door canvassing is talking to targeted voter, for phone calls, talking to targeted voter.” So robo calls, emails, and direct mail have no real impact for GOTV, and it should be noted that television and radio raise turnout by less than a point. That is not even targeted GOTV. It just raises turnout generally, not necessarily among a campaign’s targeted voters.

The study came up with the $29 a vote for door-to-door by calculating $16 an hour and 6 contacts per hour. The live calls were based off $16 an hour and 16 contacts and hour. Imagine if you were able to drive down costs for doors and phones to, say, $10 an hour, and then drive up doors to 10 contacts an hour and calls to 25 contacts an hour. That’s what campaign technology like Voter Gravity can do: make volunteers more efficient and effective by targeting the right voters so that more of the right work can be done in a shorter amount of time.

Never Stop Learning: Using Campaign Technology to Test Theories in the Field

Most campaign consultants with the authority to make important decisions have decades of experience in politics. Many are very good at making these decisions, using the knowledge they’ve accumulated over all those years to create high quality strategies for winning elections.

The most valuable of these lessons are learned not from years of successful campaigning, but from years of mistakes. While there are many strategists who have fantastic ideas about properly messaging to and turning out voters, few have the empirical evidence to authoritatively confirm their beliefs.

For example, most consultants have ideas about matching the demographics of their volunteers and the voters to whom they’ll be speaking. Others have strong inklings about different groups of voters and how they’ll respond to different types of mailers (from color choices to language and messaging decisions).

Not enough of these consultants, however, have actually tested these theories in the field. Without a control group of voters with whom the “less efficient” strategies have been tested and shown to be unsuccessful, it is impossible to know for sure whether a certain strategy is best.

After the well-documented success of the 2012 Obama campaign’s use of campaign technology and A/B testing, more and more Republican efforts are beginning to utilize this technique. Despite its unquestionably rational credentials, however, the decision to dedicate a political outfit’s strategy formation to this more scientific methodology is rarely an easy one to make. There are two main reasons for this.

First, it is not often in the individual best interest (especially short-term) of a political consultant to discover that some (or even most) of his or her ideas could be wrong. For example, when a campaign identifies 5,000 supporters for a local election, and the candidate then gets 10,000 votes, the consultant will benefit from the assumption that basically every one of those 5,000 tagged supporters showed up on election day.

Looking back on the campaign with an analysis of election history data to find out which tagged supporters actually showed up on election day has the potential to teach consultants a significant amount about how to improve their turnout operations. And while even more could be learned from the utilization of A/B GOTV strategy testing in such an analysis (a technique which we highly recommend to everyone), even the simpler process of throwing supporter data up against microtargeted turnout statistics is too rarely seen in today’s Republican consulting climate.

Second, a consultant’s ability to learn new things about campaign strategy starts with a willingness to admit that he or she may have been doing things in a sub-optimal way – in many cases, for a very long time. The longer a strategist has been honing the craft, the more experience they gain. This experience often leads to greater power and responsibility, yet it also frequently serves as an obstacle to open-minded discussion when it comes to learning new things about how best to reach and turn out voters.

To ensure your campaign is utilizing the most efficient strategies possible, always be willing to let go of prior beliefs about how campaigns “should” use data. And never stop looking for new ways to experiment and improve upon everything you’ve learned so far. Discovering that your favorite strategy might not actually work as well as you thought won’t feel great at first, and you can be sure that such feedback is the best way to ensure that your campaign reaches its full potential.

Feeling like you know more about campaigning than your opposition is wonderful.

Winning is even better.